Your VPS resource limits and monitoring
Your container has fixed CPU, RAM and disk quotas. The dashboard shows your current usage against them, so you can notice a problem early. This guide explains the numbers and what happens when RAM runs out.
Live monitoring
The Overview page shows live CPU load, RAM, swap, disk usage, network traffic and the ZFS compression ratio of your container.
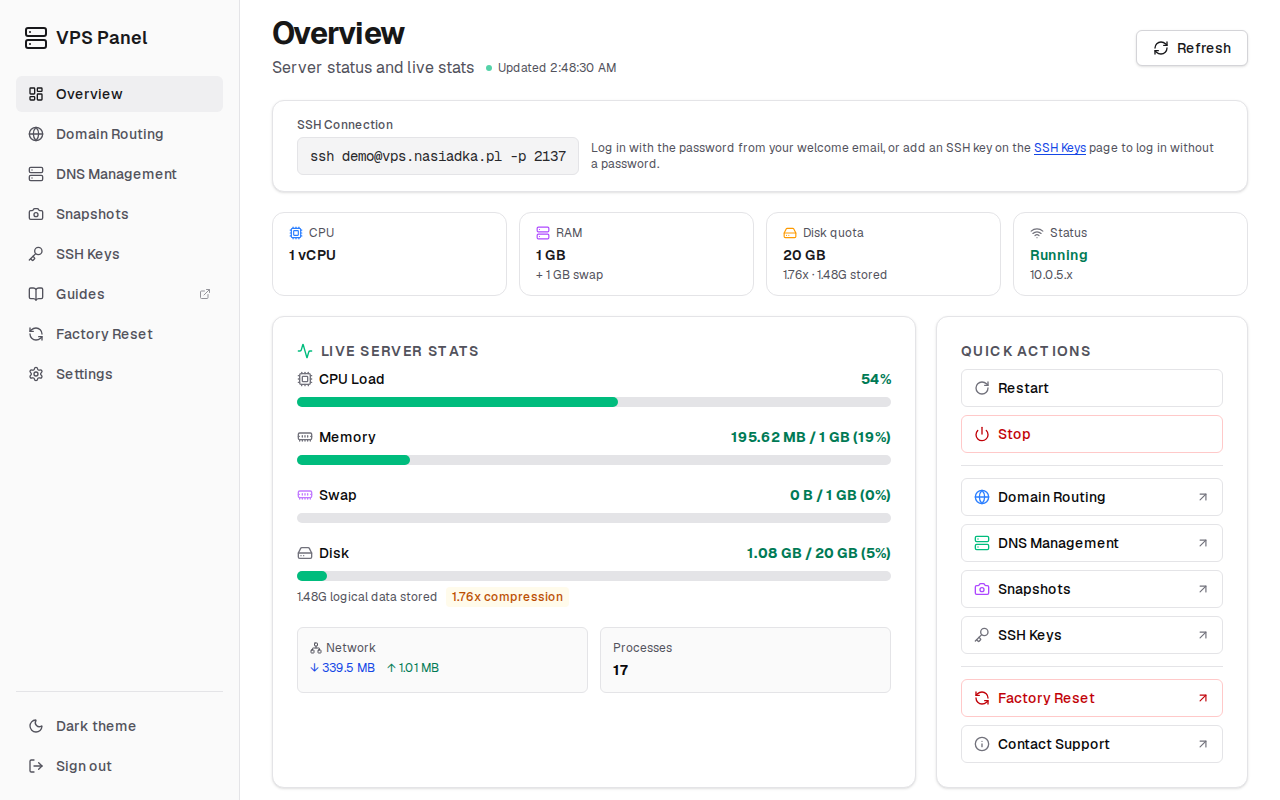
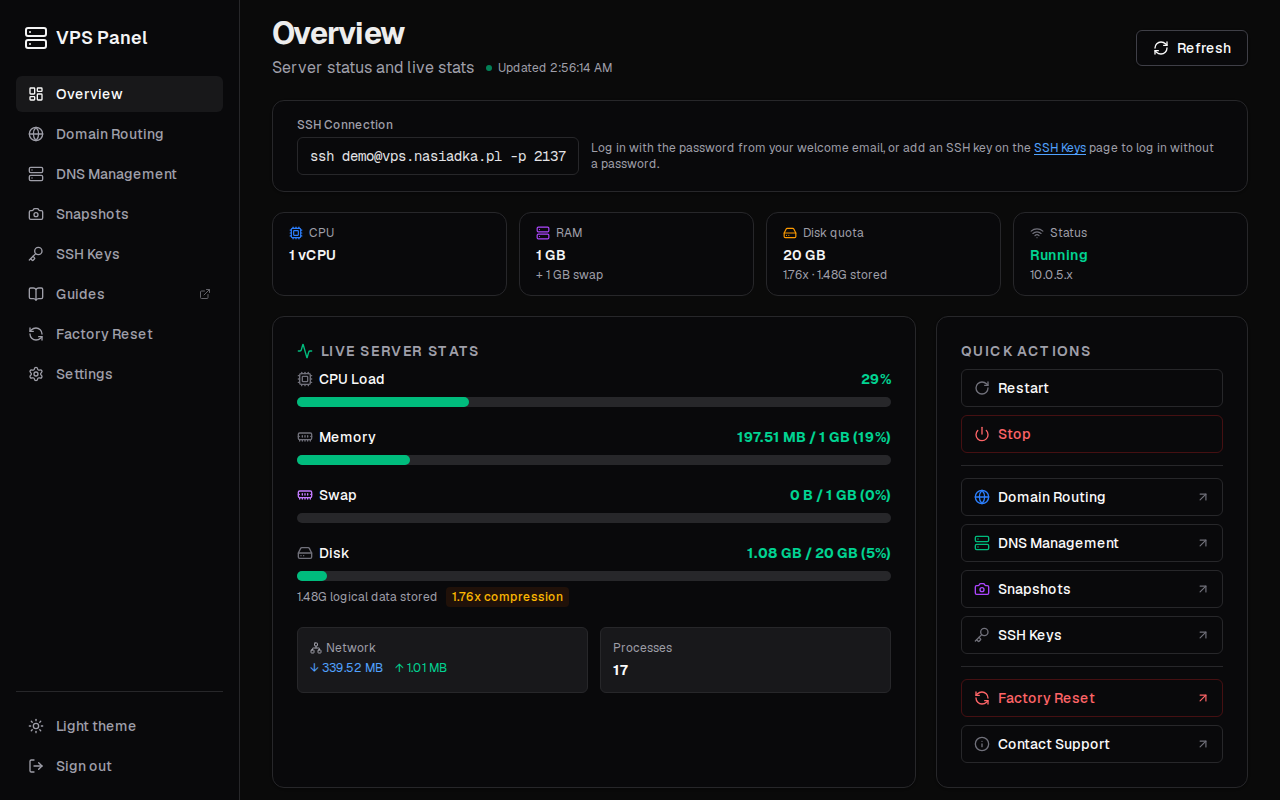
The dashboard has a light and a dark theme. Switch between them with the toggle at the bottom of the sidebar.
What happens when RAM fills up
When RAM is full, the container uses swap (disk space used as extra memory), so short spikes do not stop your app. If swap is full too, the OOM killer (the system's "out of memory" killer) stops the process that uses the most memory, often a database or a Node.js server.
To reduce the risk, use one or more of these measures:
- Limit the Node.js heap (the memory a Node.js app uses for its data), for example with
NODE_OPTIONS=--max-old-space-size=256. With PM2, put the variable before the start command:NODE_OPTIONS=--max-old-space-size=256 pm2 start app.js --name myapp. See Keep your apps running with PM2. - Limit the cache size of any database you run, for example the MongoDB WiredTiger cache in
mongod.conf. - Stop services that you do not use.
Disk and ZFS compression
Your disk quota counts the physical space your files use after compression. The storage uses ZFS, a file system with built-in LZ4 compression, so compression works automatically. Text, code, logs and JSON typically compress 1.5 to 3 times, so you can store more than the quota suggests. Files that are already compressed, such as ZIP files, images and video, gain little.
df -h /